
Analizziamo le disuguaglianze dal punto di vista economico, attraverso un breve viaggio fra le più significative disparità negli Stati Uniti
In recent years, you have often probably encountered the word inequality while reading or listening to different sources. If we simply type this word into Google scholar (or any other search engines), we will get a different array of inequality terms, like gender inequality, racial inequality, wealth inequality, income inequality, poverty inequality and many others. According to Sir Anthony Barnes Atkinson, a British economist known to have been at the forefront of research on inequality, to have created the Atkinson index of inequality and have mentored Thomas Piketty with whom he created the unique World Wealth and Income Database on top incomes, economic inequality is only recently receiving more attention than when he first started working on the subject in the 1960s. Particularly after Thomas Piketty’s book Capital in the Twenty-First Century, there has been an enormous media coverage and attention from world leaders (Atkinson, 2015).
But why do we care about understanding inequalities? In this first article, we will mostly talk about inequalities from an economic point of view and we will take a trip in some of the most vivid disparities of the United States.
First, what do we mean by inequality? As already noted by Simon Kuznets (1955), Nobel Prize economist who – among other things – discovered an inverted U-shaped relation between income inequality and economic growth, it means very different things to very different people as this is a field of study which is plagued by looseness in definitions (Figure 1). We know that we are referring to something that is not equal, for example in terms of status, rights and opportunities. This is especially related to social justice theories. However, if we talk about “economic inequality” then we are most likely referring to income disparities, unequal living standards or also wealth inequalities.

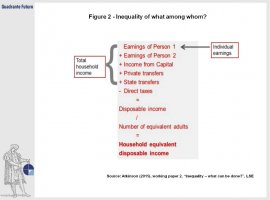

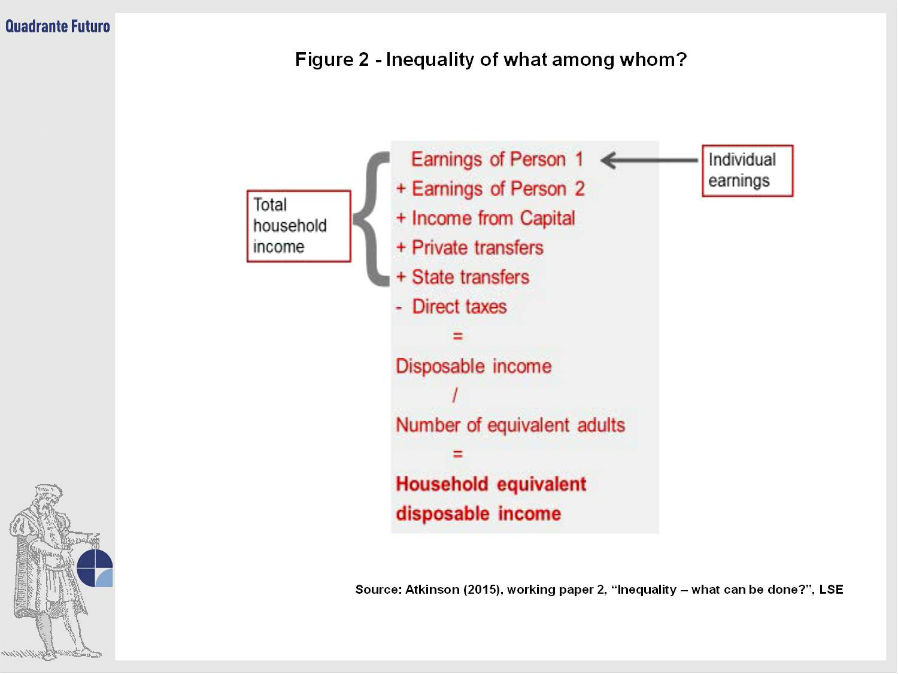
In this latter case, the ongoing debate and scientific research is mostly looking at the top income shares of the population (the famous top 1%). If we only consider inequality of income, then in this case some people may think about individual earnings, meaning the gap in pay between those at the top and those at the bottom of the income scale. Other individuals might instead think about household income. However, income itself is not only the yearly pay you get from your employer. An individual can also receive income from investments, transfers (child benefits) or also inherited wealth. Figure 2 provides an interesting explanation on this. But at this point, if there isn’t a clear definition of inequality and considering that the individuals have different perceptions and preferences, then it could be interesting to delve into this topic by acting as a tourist travelling, in this case, to the United States.
When we talk about inequality, we usually refer to inequality of countries. In the literature, much has been investigated on this from different researchers. Among others, Acemoglu and Robinson analyze how institutions can explain much of these differences, especially when looking at countries that are divided by a border. One interesting example is the city of Nogales. Two halves of what is basically the same city, one half is in Arizona, United States and the other half is in Mexico. They have everything in common in terms of culture, history and geography. Today, however, these two cities show largely different economic performances in terms of living standards and average household income, which in the American Nogales is around $30.000 a year while in the Mexican Nogales is about $10.000; 2015 income data. However, we should consider that the Nogales citizens in Arizona have access to the American economic and political institutions that, for example, allow them to open a business, take part in a democratic voting process, have access to a healthcare coverage plan and public services. The citizens of Nogales Mexico are of course under different institutions.
Similar to Nogales, in terms of divided cities, there are many examples worldwide. Therefore, there are many reasons to consider also inequality within cities, in order to understand the causes and consequences of urban inequality, especially if we take into account that individuals move across space. Thus, the disparity of a particular city or region is also a reflection of the skills of these individuals as potential workers. Figure 3, as from the latest OECD report on Inequality trends, analyses the education performance at different levels of inequality of three main social groups (people whose parents come from high, medium and low educational backgrounds (PEB)). These are the results of a OECD skills survey. We can clearly see that rising inequality lowers the skills of poor individuals, thus reducing their ability to invest in their own skills and education.
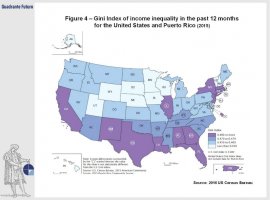
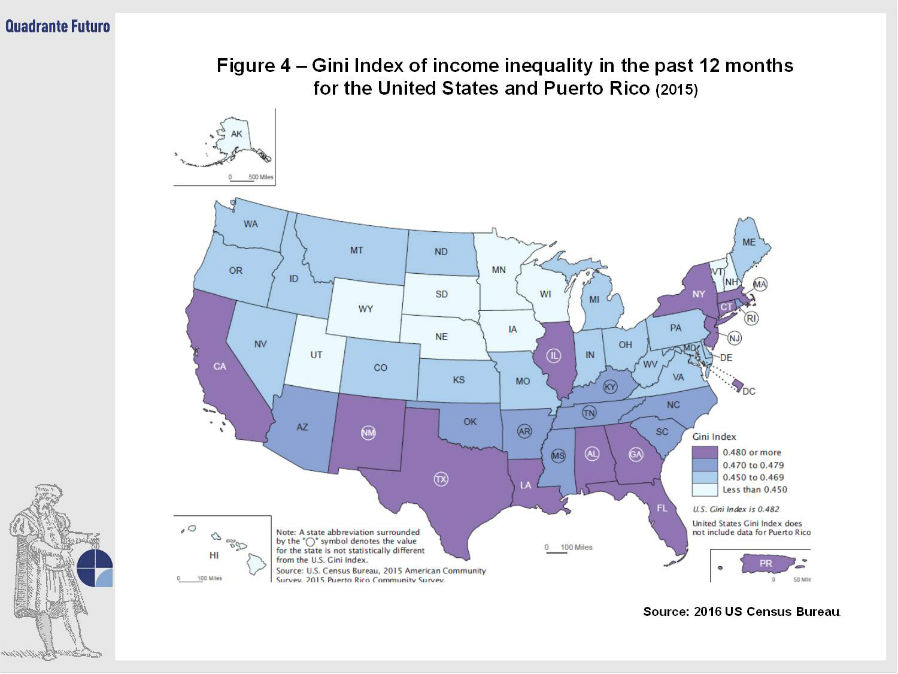
Within this framework, America is relatively unequal but at the same time it has cities and regions which are more equal than many others. Figure 4 clearly depicts this. According to the latest American Community Survey report on household income of the US Census Bureau, the states with the highest inequality are the one reported in purple, just to name some, New York, Connecticut, New Jersey, Florida, Illinois, Texas and, California. In this case, household income inequality is captured via the Gini coefficient which is an index that can take a value between 0 and 1, where 0 stands for perfect equality and 1 perfect inequality.
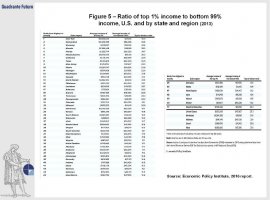
Las Vegas, Nevada is one of the top world tourist attractions, mostly known as a destination for gambling, nightclubs and retails. According to a recent report of the Economic Policy Institute, in 2013 income inequality was much higher in many states, cities and counties than for the United States as a whole. 54 of 916 metropolitan areas had gaps wider than the national gap, and in the 12 most unequal areas, the top 1% families have an average income at least 40 times greater than that of the bottom 99%, as shown in Figure 5. Among these areas, we can also find the metropolitan areas of Las Vegas, Henderson and Paradise. If you enter Vegas from highway 91, besides seeing the famous welcome sign, you can actually breath inequality in the air, especially if you just came from the Death Valley where desert sand is all you can get. The casino skyscrapers are standing out in the swankiness of Vegas skyline and the gold shiny 64-story luxury Trump tower hotel, with two giants black T on each side of the upper part of the building, is standing right in front of you. Even if you enter one of these beautiful casinos, like the Bellagio, there is some kind of differentiation. For instance, if you happen to have a room with view than you will take the elevator going up the Spa tower, and the upper you go the finer the setting and the outfit of the guests of the hotel. Once you are back at the main lobby area, the inequalities are rather mixed, you can find families ready to enjoy a pleasant weekend, couples on their honeymoon, tourists ready to experience an unreal adventure, gamblers betting on slot machines as if they were glued to that same leather stool with complimentary beer in one hand and a container for their lucky coins in the other hand, or elite individuals that sneakingly disappear in private VIP areas for a blackjack session among equals. The point is that, you can expect this from Vegas, but far less from other cities.
When you leave Phoenix, Arizona most likely you end up with a very different impression than when you arrived. With a temperature that can easily reach 114 degrees Fahrenheit (45 degrees Celsius) in the middle of the monsoon season, and 20-25 degrees Celsius in the winter time, Phoenix is another interesting example of the inequality ladder changing dramatically as you go up, but up where? This time, instead of taking an elevator up to the most exclusive suites of a hotel, you can drive up a hill (Camelback mountain) to look at some of the wealthiest area of the Phoenix metro area, according to the Phoenix wealthiest zip codes list. You can easily see the impact of the gentrification process and wage gap on the reshape of many urban neighborhoods of the city. What does it mean gentrification? It comes from gentry, “gentle birth”, and back in the 16th century it was associated to the influx of the middle-class shifting the lower-class worker residents to urban neighborhoods. In many cases, this process triggers an increase in property rents, taxes and public services. Phoenix is an example where this was particularly intense. Gentrification though is another controversial issue that divides the views of scholars. However, continuing our tour towards Camelback mountain it is amazing to see the changing neighborhoods mile after mile, the street illumination that starts to decrease drastically to avoid disturbing the privacy and quiet of the owners of these beautiful mansions, the temperature that goes down by at least 10 degrees Fahrenheit (12 Celsius) due to the proximity to the hill and the decrease in concrete structures like molls and other general stores. The upper you go the bigger the houses. The most expensive mansion is worth $75 million. There are several reasons why wealthy individuals decide to buy their second house in Phoenix: low property taxes (nearly the lowest in the US), the temperate climate during winter, the numerous golf courses and the recreational activities that the nearby hills offer. Phoenix is number one golf destination in the whole United States. Most of these mansions’ owners are CEOs, retired CEOs, actors/actresses or professional sports players.
These are, of course, just some examples of economic inequalities across the United States, but we could easily repeat this exercise, which from an econometric perspective we could call a difference in difference analysis, also for other countries like Italy. Summarizing what we saw in our trip, we can say that one argument that we can confirm and follow to understand these differences in living standards is the hypothesis about the role of institutions (a là Acemoglu and Robinson). The economic and political institutions of a country, region or metropolitan area can explain these inequalities and the different growing patterns. However, looking at Las Vegas and Phoenix, we can also consider different hypothesis, for instance the geography hypothesis. In Vegas, the investment policies in the gambling industry is also due to the unique landscape of the area. In Phoenix is more a combination of the institutions and the geography which favors it being a golf and winter-break destination. In a second article, we will investigate the issue of economic inequalities related to our country, Italy, both from a macro and microeconomic perspective.
© Riproduzione riservata


